Building a KPI dashboard people actually use
Start from the decisions the dashboard should support, choose a handful of measures, and design it so the important change is visible at a glance.

- screen for the headline view
- 1
- kinds of indicator: leading and lagging
- 2
- parts of a SMART measure
- 5
Many dashboards are built with care, shared with enthusiasm, and then quietly ignored. Usually the problem is not the software or the charts. It is that nobody agreed what the dashboard was for. A dashboard that people use starts from a decision, shows a few numbers that inform it, and makes change visible at a glance.
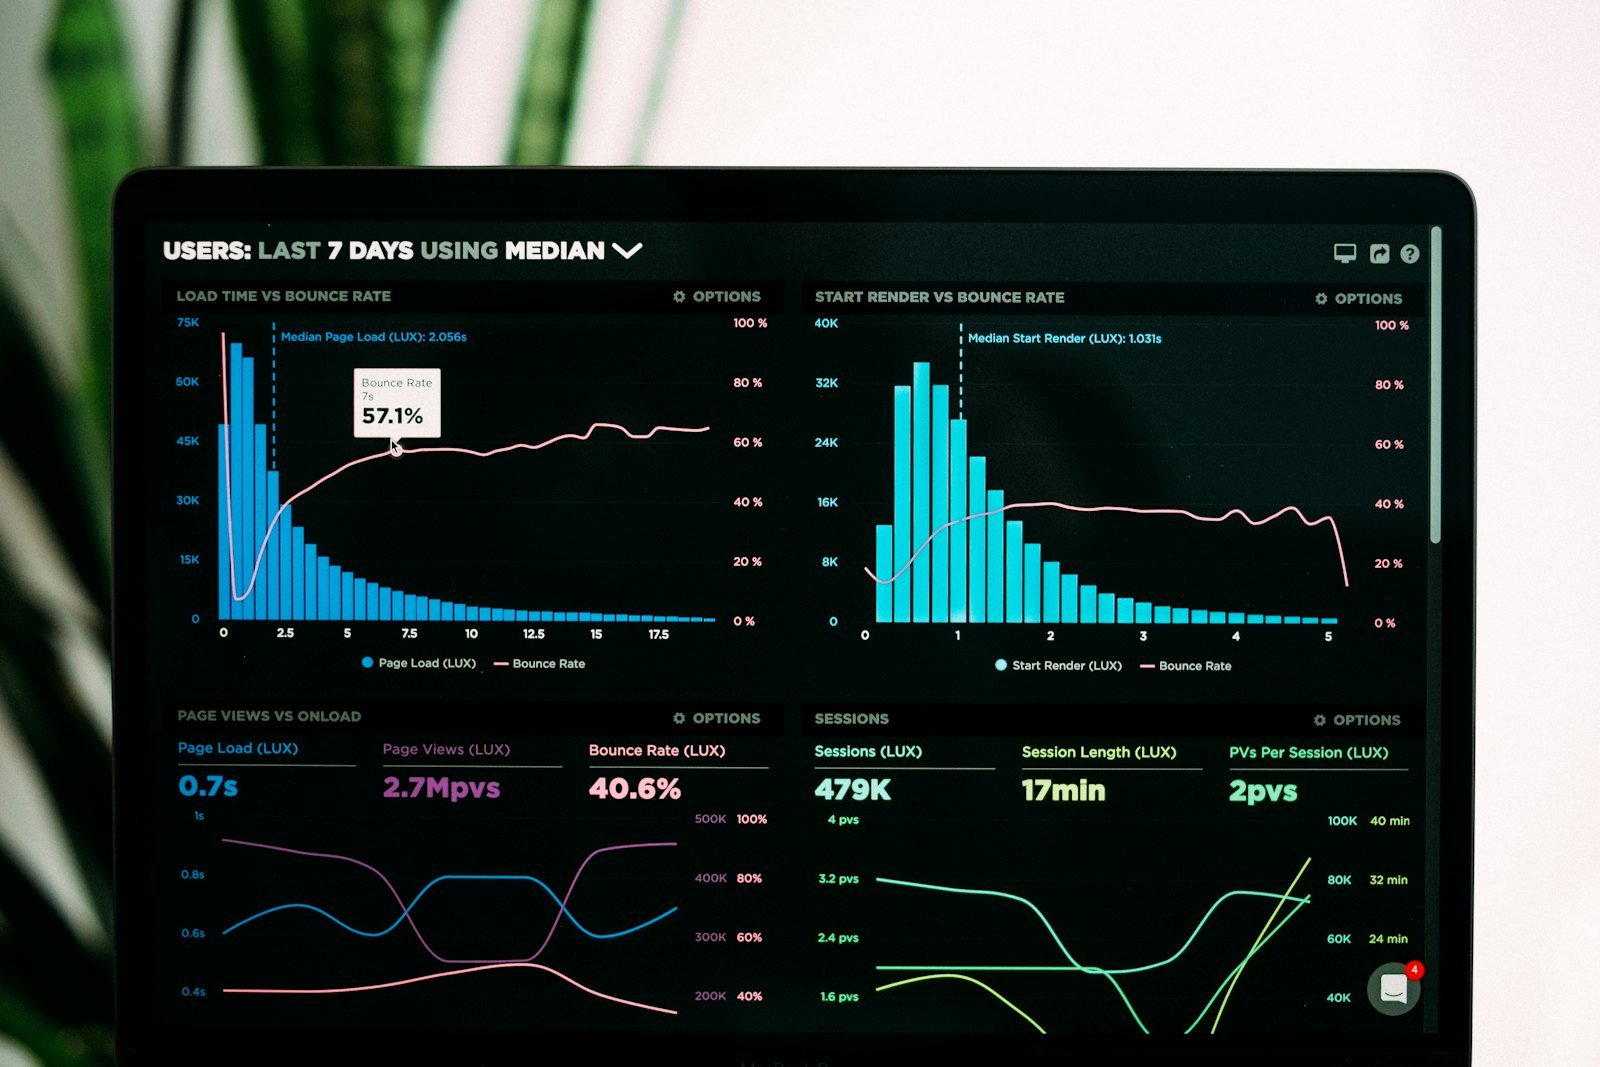
Start from decisions
Before opening Excel, Looker Studio, Power BI or anything else, answer three questions:
- Who will look at this, and how often?
- What decisions do they make in that time?
- What would they need to see to make those decisions well?
A sales manager deciding each Monday where to focus the team needs a different dashboard from a founder reviewing the month. Trying to serve both on one screen usually serves neither.
Choose a few KPIs
A key performance indicator measures progress towards a defined objective. The word “key” matters. If there are twenty, none of them is key. Aim for around five to seven on the main view, with detail on a second page.
For each KPI, write down:
- A precise definition. Does “active customer” mean ordered this month, or logged in this month?
- The data source and how often it refreshes.
- An owner who explains it when it moves.
- A target or threshold that marks good and bad.
The SMART test helps: each measure should be specific, measurable, achievable, relevant and time-bound.
Balance leading and lagging indicators
Lagging indicators record results that have already happened: revenue, profit, churn. They matter, but by the time they move it is too late to change them. Leading indicators are the activities that drive those results and can be acted on now: proposals sent, demo calls booked, trial sign-ups, delivery times.
A useful dashboard pairs them. If revenue (lagging) is the goal, show the pipeline or enquiries (leading) that predict it.
Always give a comparison
A number on its own tells the reader little. “Orders: 412” means nothing until you know whether that is good. Show each KPI against at least one of:
- its target;
- the previous period;
- the same period last year, for seasonal businesses.
Use colour sparingly, mainly to flag numbers outside their target range. If everything is coloured, nothing stands out.
Lay it out for a quick read
Stephen Few, whose book Information Dashboard Design shaped much current practice, stressed that a dashboard should give an at-a-glance view. A simple layout that works:
| Area | Content |
|---|---|
| Top row | Headline KPIs as large numbers with change against target |
| Middle | Trend lines for the same KPIs over recent weeks or months |
| Lower | Breakdowns by region, product or channel to explain the change |
| Footer | Definitions, data source and last refresh time |
Prefer simple bar and line charts. Avoid 3D effects, gauges that take up space to show one number, and pie charts with many slices.
An example (illustration only)
An online shop’s weekly dashboard might show five headline numbers: revenue against target, orders, average order value, repeat customer share, and on-time delivery rate. Underneath sit weekly trend lines, then a breakdown of revenue by channel. Any measure outside its target appears in a muted red. The marketing lead owns repeat share; the operations lead owns delivery. These are invented examples of the structure, not recommended targets.
Watch for gaming
Goodhart’s law, often phrased as “when a measure becomes a target, it ceases to be a good measure”, is a real risk with dashboards. If a support team is judged only on tickets closed, tickets may be closed before problems are solved. Pair measures that keep each other honest, such as tickets closed with customer satisfaction, and review definitions when behaviour seems to bend around them.
Build a review habit
A dashboard becomes useful when it is part of a routine. Set a fixed time, for example Monday morning, when the owner of each KPI explains any movement and agrees an action. Record those actions. Over time, the dashboard becomes a record of decisions, not just numbers.
Keep it lean
- Every quarter, ask who uses each chart and remove any that nobody misses.
- Show when data was last refreshed, so people trust what they see.
- Test the dashboard on a phone if people will open it there.
- Keep a short definitions page; most arguments about numbers are really about definitions.
Framework
Five layers of a useful dashboard
- DecisionWhat will someone do differently after looking at it?
- MeasuresA few KPIs tied to that decision, each with an owner
- ComparisonEvery number shown against a target or previous period
- LayoutMost important number top left, detail lower down
- RhythmA fixed review time and a named person who acts
Checklist
Put it to work
Quick quiz
Check what stuck
Which is a leading indicator for a consultancy?
A number on a dashboard is most useful when shown…
Goodhart's law warns that…
Recap cards
Tap a card to check yourself.
Sources and credits
